
|


Tutoriel MySQL - Highcharts
Customizing charts using Highcharts API
I will explain how to use the Highcharts API.
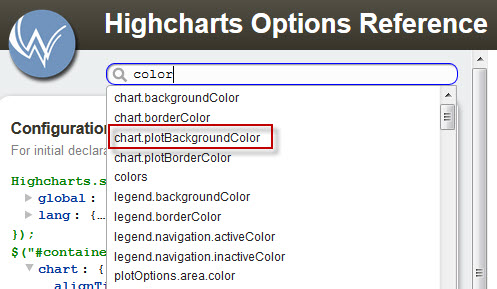
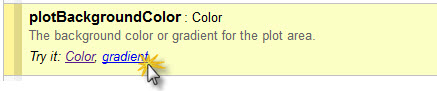
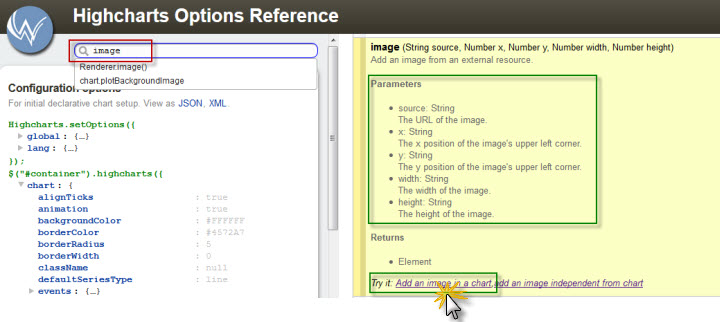
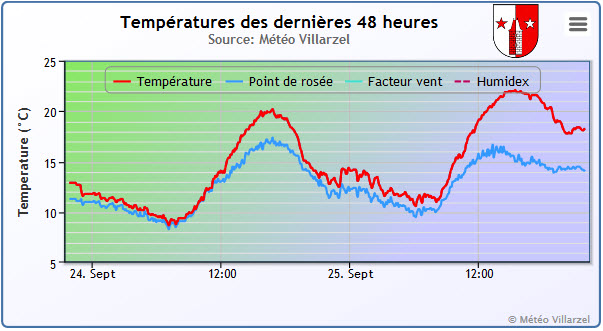
Suppose we want to put a background color on our chart "temperature" Let the references page http://api.highcharts.com/highcharts In the search window, type a keyword, such as color or background. In the results window, click chart.plotBackgroundColor In the right window, the options are displayed, choose the color (solid color) or gradient (gradient)
let's do a little crazy and choose a gradient. Then click on gradient.Opens a new browser window, the site http://jsfiddle.net, you can try all options
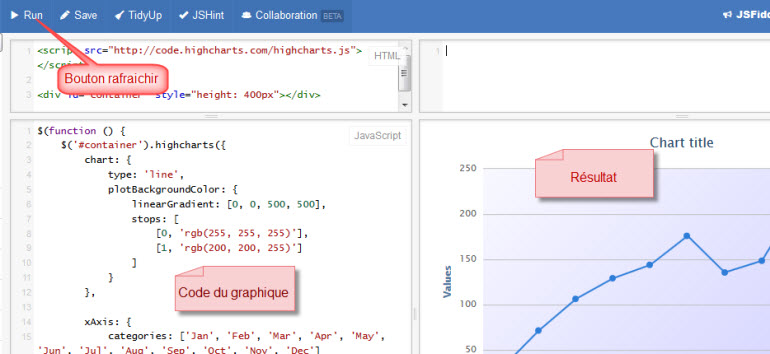
Highcharts, here's how.In the code, we found our option "plotBackgroundColor" plotBackgroundColor: {
linearGradient: [0, 0, 500, 500],
stops: [
[0, 'rgb(255, 255, 255)'],
[1, 'rgb(200, 200, 255)']
]
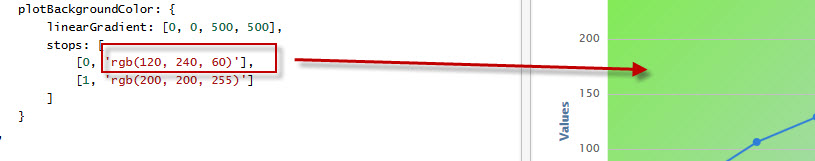
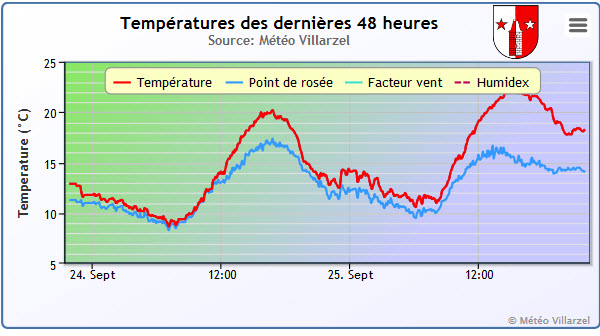
}Try changing the values in green above and updating with the "Run" button; You will see the result in the box to the right. For example, I can change the initial color is [0, 'rgb(255, 255, 255)'], by [0, 'rgb(120, 240, 60)'], and Pulse Run As the result, the first color changed from white to light green Now just insert the code in our file like this: chart: {
renderTo: 'container',
zoomType: 'x',
type: 'spline',
marginRight: 10,
marginBottom: 60,
plotBorderColor: '#346691',
plotBorderWidth: 1,
plotBackgroundColor: {
linearGradient: [0, 0, 300, 300],
stops: [
[0, 'rgb(120, 240, 60)'],
[1, 'rgb(200, 200, 255)']
]
}
},
CAUTION: You must close all brackets [], parentheses (), braces {}
and do not forget a comma, otherwise the graph is not displayed.
Tip: After each change, try the result.
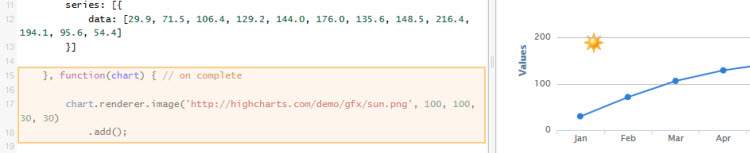
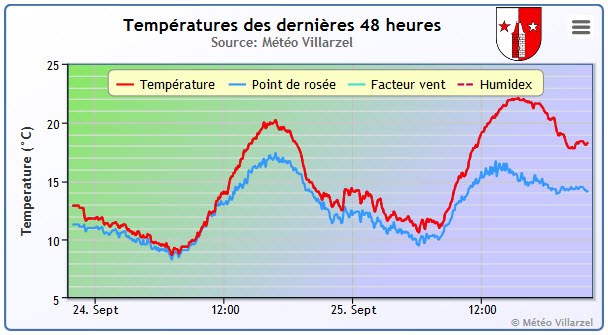
Another example, let's add an image to our chart.
Clicking the link, the page opens http://jsfiddle.net/ and retrieve the code We insert this code in our graph
color: '#bd005c',
dashStyle: 'ShortDash',
data: comArr(outdoorheatindex),
}
]
}, function(chart) {
chart.renderer.image('http://www.boock.ch/meteo/images/ban_villarzel.gif', 450, 3, 43, 50)
.add();
});
});
});with parameters such as the URL of the image, the x position, y position, the width of the image, the image height
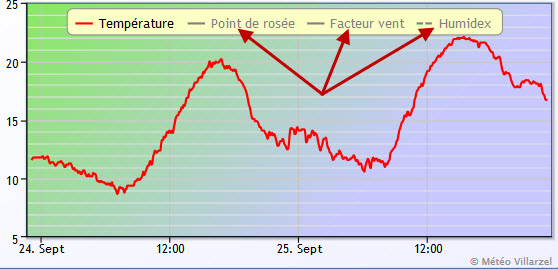
A final example, let's change the position and customize our legend, we did Search "legend"In the right window, you will see all the options available to the legend.
In our graph does not refer to the legend grew as ASTE is the default.
Therefore, it is necessary to introduce into any part of our code, this label "legend"; the place does not matter, simply
insert the end of another option. For example we chose to put it after the label "credit" for what we after the last
comma on the option of "credits".credits: {
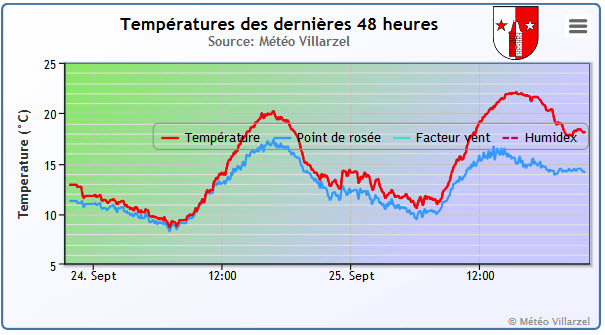
text: '© Météo Villarzel',
href: 'http://www.boock.ch/meteo-villarzel.php'
},
legend: {
align: 'right',
verticalAlign: 'top',
x: 0,
y: 100
},The result is not terrible Now focus this legend at the top of the chart. You have to play with the X and Y values ??to achieve the desired result. legend: {
align: 'center',
verticalAlign: 'center',
x: 20,
y: 50,
},Now we put a background color to make it more visible legend: {
align: 'center',
verticalAlign: 'center',
x: 20,
y: 50,
backgroundColor: '#FCFFC5'
},That's better, but there is still too much space on the bottom of the graph Remember, at the beginning of the graph of code, we have defined a lower margin "MarginBottom: 60"
This value will reduce to 30chart: {
renderTo: 'container',
zoomType: 'x',
type: 'spline',
marginRight: 10,
marginBottom: 30,
plotBorderColor: '#346691',
plotBorderWidth: 1,One last thing, if there is a variable that does not want to display on the chart, simply add this code in "data" {
name: 'Point de rosée',
color: '#3399FF',
visible: false,
data: comArr(dewpoint)
},Now it's your turn to play with the countless options APIs,
absolutely everything is customizable, but you have to put to work.


|
|
||||||||

|
Station
Davis Vantage Pro 2 + station agricole - Weatherlink
6.0.0 - GraphWeather
3.0.15
© 2010-2013, Météo Villarzel - Webmaster Aubert Pierre-André Attention, les données météo publiées sur ce site sont issues d'une station météo personnelle et ne sont données qu'à titre indicatif, elles ne peuvent en aucun cas être utilisées pour garantir la protection des personnes ou de biens quelconques. |
|||||
|
Stations amies
|
|||||
|
|
|
|
|
|
|