
|


Tutoriel MySQL - Highcharts
the graph
We begin our famous chart?
Yes, we started installing the calls to bookstores, which are java script. Also in the same file is added:
<script type="text/javascript" src="../highcharts3/js/highcharts.js"></script>
<script type="text/javascript" src="../highcharts3/themes/grid.js"></script>
<script type="text/javascript" src="../highcharts3/js/modules/exporting.js"></script>
Change access depending on your site configuration and name that you configured for file paths Highcharts
The jquerry.min.js script is required.
The highcharts.js script is required, this is the main script of Highcharts library.
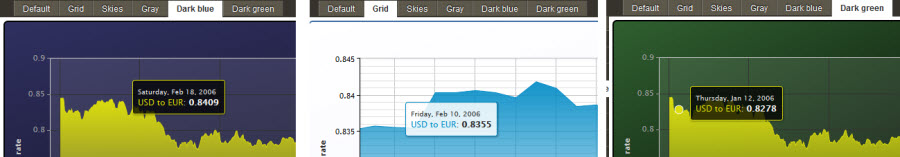
The grid.js script is optional, is what defines the overall graphs of your chart, there are five predefined themes default Exemple. Exemple
To change a theme, replace the line in the name of the js file
<script type="text/javascript" src="../highcharts3/themes/grid.js"></script>
<script type="text/javascript" src="../highcharts3/themes/dark-blue.js"></script>
<script type="text/javascript" src="../highcharts3/themes/dark-green.js"></script>
<script type="text/javascript" src="../highcharts3/themes/gray.js"></script>
<script type="text/javascript" src="../highcharts3/themes/skies.js"></script>
OBVIOUSLY THERE IS NOTHING MORE THAN TO PUT A SUBJECT
If you choose to set a theme, you can still change the appearance of the graph with Highcharts API.Example: you put<script type="text/javascript" src="../highcharts3/themes/dark-blue.js"></script> and get the Example: you put <script type="text/javascript" src="../highcharts3/themes/dark-green.js"></script> and get the Example: you put <script type="text/javascript" src="../highcharts3/themes/gray.js"></script> and get the The Exporting.js script is only for the export icon located in the graphics on the top rights
We started with the code from the chart itself, all these features are available using Highcharts (API)
http://www.highcharts.com/docs general documentation
http://api.highcharts.com/highcharts API codes
Later I will explain how to make some changes with APIsAlso in the same file, then insert the Highcharts code, because as java script, you start with the js tag. Next, the function of (time) is set to the x axis <script type="text/javascript"> function comArr(unitsArray) {
var outarr = [];
for (var i = 0; i < time.length; i++) {
outarr[i] = [time[i], unitsArray[i]];
}
return outarr;
}We define the general settings and the translation <script type="text/javascript"> function comArr(unitsArray) {
var outarr = [];
for (var i = 0; i < time.length; i++) {
outarr[i] = [time[i], unitsArray[i]];
}
return outarr;
} $(function () {
var chart;
$(document).ready(function() {
var highchartsOptions = Highcharts.setOptions(Highcharts.theme);
Highcharts.setOptions({
lang: {
months: ["Janvier "," Février "," Mars "," Avril "," Mai "," Juin "," Juillet "," Août "," Septembre "," Octobre "," Novembre "," Décembre"],
weekdays: ["Dim "," Lun "," Mar "," Mer "," Jeu "," Ven "," Sam"],
shortMonths: ['Jan', 'Fev', 'Mar', 'Avr', 'Mai', 'Juin', 'Juil','Août', 'Sept', 'Oct ', 'Nov', 'Déc'],
decimalPoint: ',',
resetZoom: 'Reset zoom',
resetZoomTitle: 'Reset zoom à 1:1',
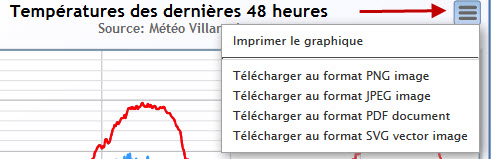
downloadPNG: "Télécharger au format PNG image",
downloadJPEG: "Télécharger au format JPEG image",
downloadPDF: "Télécharger au format PDF document",
downloadSVG: "Télécharger au format SVG vector image",
exportButtonTitle: "Exporter image ou document",
printChart: "Imprimer le graphique",
loading: "Chargement..."
}
});You can change the text (translation) in green, do not touch the rest of the code, will be the basis of all graphs.
default language is English, you can suppromer these lines
We define the general graph caraterísticaschart = new Highcharts.Chart({
chart: { renderTo: 'container', zoomType: 'x',
type: 'spline',
marginRight: 10,
marginBottom: 60,
plotBorderColor: '#346691',
plotBorderWidth: 1,
},renderTo: 'container', = is the name of your chart, you must assign a unique name to each graph zoomType 'x' = indicates the type of zoom that allows your graph x, I x. If you do not get anything, not be possible to zoom type: 'spline' path type = Y, line, spline, column, area, pie, bar, etc ... marginRight: 10 = The right margin in pixels (pxs) marginBottom: 60, = MarginBottom: 60, = the lower margin in pxs plotBorderColor: '#346691', color = outer edge plotBorderWidth: 1, = width of the outer edge
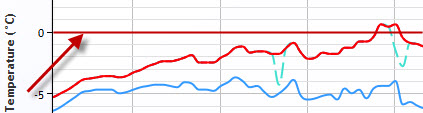
A title is added to the graph.
It can be placed on x and y is in pxs or eg center, left, right, etc....title: { text: 'Temperatures in the last 48 hours', x: -20 },On peut aussi rajouter un sous-titre subtitle: {
text: 'Source: Météo Villarzel',
x: -20
},Credit is the text that appears in the bottom right of the graph, default is "highcharts.com" but can be changed credits: {
text: '© Météo Villarzel',
href: 'http://www.boock.ch/meteo-villarzel.php'
},As regards the time taken to do this tutorial, I would appreciate you not modify this code.
if you use these scripts, not directly attributed authorship (putting your name) or indirectly (without indicating the source).
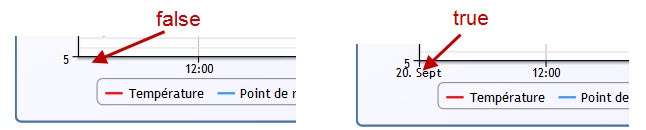
We define the x axisxAxis: {
type: 'datetime',
startOnTick: false,
},
startOnTick = false ou true
we define the y axis
Option: plotlines set a line on the shaft and "value" 0 ° C in this example, with a width "width" of 1pxs and redyAxis: {
title: {
text: 'Temperature (°C)'
},
plotLines: [{
value: 0,
width: 1,
color: '#FF0000'
}]
},
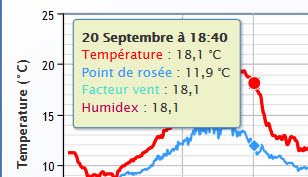
The "Information Tool" is the legend that appears when you put your mouse over a curve definedtooltip: {
crosshairs:[true],
borderColor: '#4b85b7',
shared: true,
backgroundColor: '#edf1c8',
formatter: function() {
var s = '<b>'+ Highcharts.dateFormat('%e %B à %H:%M', this.x) +'</b>';
$.each(this.points, function(i, point) {
var unit = {
'Dewpoin': ' °C',
'Température': ' °C',
'Windchill' : '',
'Humidex' : ''
}[this.point.series.name];
s = s + '<br>' + '<span style="color:'+ point.series.color +'">' + point.series.name + ' </span> : '
+Highcharts.numberFormat(point.y,1,","," ") + unit;
});
return s;
},
},The "crosshairs" is a line that shows the xy position of the mouse on the chart ..
[true], = Only the axis x
[true, true], = x and y axis
[false], = no lineborderColor: '#4b85b7', = The border color of tooltip
shared: true, = tooltip visible
shared: false, = tooltip invisible
backgroundColor: '#edf1c8', = color of tooltip
Highcharts.dateFormat('%e %B à %H:%M', this.x) = the date forma (axe x)
var unit = {
'Dew Point': ' °C',
'Température': ' °C',
'Windchill' : '',
'Humidex' : ''Var unit allows different units for each curve (y-axis) the name must be identical to the name of the series.
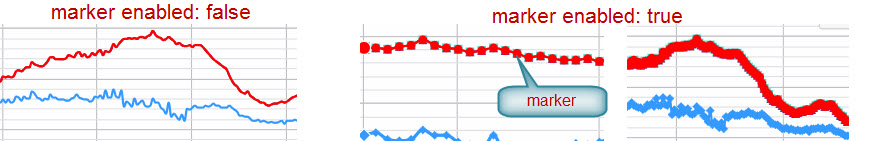
Markers on the curves are deleted, as there are many and that makes visibility.
plotOptions: {
				series: {
					marker: {
						enabled: false
					}
				}
			},
Well, we're almost done, we have to define the data "data" of the y-axis and
{
name: 'Temperature',
zIndex: 1,
color: '#ff0000',
data: comArr(outdoortemperature)
},
{
name: 'Dewpoint',
color: '#3399FF',
data: comArr(dewpoint)
},
{
name: 'Windchill',
color: '#40e0d0',
dashStyle: 'LongDash',
data: comArr(windchill),
},
{
name: 'Humidex',
color: '#bd005c',
dashStyle: 'ShortDash',
data: comArr(outdoorheatindex),
}
]name: 'Température', = the name you want to give your curve
zIndex: 1, = here I have put a zIndex to indicate that the curve is in the foreground
color: '#ff0000', color = curve
data: comArr(outdoortemperature) = and finally the name of the data to draw
Do the same for the other 3 data.There is not only the keys and close parentheses. We close the script tag and head
});
});
</script>
</head>Now there is more to display the graph in the body "body" of the page and close the html tagl
<div id="container" style="width: 550px; height: 300px; margin: 0 auto"></div>
</body>
</html>id="container" = This is the name you defined in the beginning "renderTo: 'container',"
style="width: 550px; height: 300px; = The length and width you want to give your graph.Your chart is finished.

|
|
||||||||

|
Station
Davis Vantage Pro 2 + station agricole - Weatherlink
6.0.0 - GraphWeather
3.0.15
© 2010-2013, Météo Villarzel - Webmaster Aubert Pierre-André Attention, les données météo publiées sur ce site sont issues d'une station météo personnelle et ne sont données qu'à titre indicatif, elles ne peuvent en aucun cas être utilisées pour garantir la protection des personnes ou de biens quelconques. |
|||||
|
Stations amies
|
|||||
|
|
|
|
|
|
|