
|


Tutoriel MySQL - Highcharts
Recovery and formatting the data.
Let's start creating our table, but we must install the Highcharts library.
We will:http://www.highcharts.comClick Download, and then click Highcharts 3.x Unzip the file to a directory, for example highcharts3
installed, you can download the file here:ici
Unzip the file in your scripts folder or directly from folder its graphics
Well, started with the famous graphic?
Yup; But first, you must retrieve the data you want to put in the chart and format them as well, that are understandable to Highcharts; we use our JSON format.Open a new file in your text editor and name it, for example, 48h_temperature.php
It's php, so let's put our code in these tags, enter:
<?php
 ?>
Now our connection file database (which we created on the previous page).
As a reminder: the lines beginning with green // in this tutorial are comments, you are free to leave or delete them.
Be careful when using "cut and paste" the php code as the comment line must begin, always, by //, since, otherwise, the script will not work
require("mysql_connect.php");
?>and voila, you are already connected to the database; simple,! do not !; All right ..; now we have to go get the values
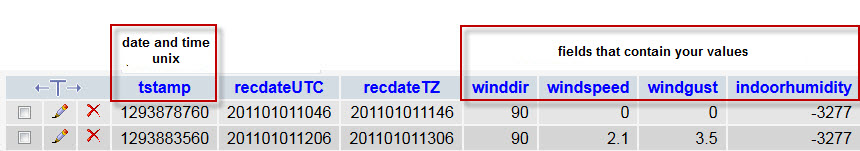
We begin with the date and time. Table tstamp select the data field; this is the time in Unix format
require("mysql_connect.php"); // The date and time of the last record is retrieved
$sql="select max(tstamp) from data";
$query=mysql_query($sql);
$list=mysql_fetch_array($query);
?>
As a reminder, since PhpMyadmin
Indicates start and stop with the time interval that wish to place on the tableque
require("mysql_connect.php"); // The date and time of the last record is retrieved
$sql="select max(tstamp) from data";
$query=mysql_query($sql);
$list=mysql_fetch_array($query); // Determines the stop and start on the way to retrieve the next request // data last xx hours $stop=$list[0];
$start=$stop-(86400*2);//24 hours // so that 86400* 2 = 48 hours
?>Now we will select the values that appear in our chart.
With the "SELECT" command, select the unix time, outside temperature, wind factor, dew point and humidex.
With "FROM" indicate that these data come from the table "data"; and then, "WHERE" tstamp determines the beginning and end (start-stop defined above) and finally classify the data with "ORDER"
require("mysql_connect.php"); // The date and time of the last record is retrieved
$sql="select max(tstamp) from data";
$query=mysql_query($sql);
$list=mysql_fetch_array($query); // Determines the stop and start on the way to retrieve the next request // data last xx hours $stop=$list[0];
$start=$stop-(86400*2);//86400=24 heures donc 86400*2=48 heures
// Retrieves data from the past 48 hours in ascending order of date and time
$sql = "SELECT tstamp, outdoortemperature, windchill, dewpoint, outdoorheatindex FROM data where tstamp >= '$start' and tstamp <= '$stop' ORDER BY 1";
$query=mysql_query($sql);
$i=0;
?>Now let's take a "while" loop to list our values.
This is the final part of the php; finish closing with?>
require("mysql_connect.php"); // The date and time of the last record is retrieved
$sql="select max(tstamp) from data";
$query=mysql_query($sql);
$list=mysql_fetch_array($query); // Determines the stop and start on the way to retrieve the next request // data last xx hours $stop=$list[0];
$start=$stop-(86400*2);//86400=24 heures donc 86400*2=48 heures
// Retrieves data from the past 48 hours in ascending order of date and time
$sql = "SELECT tstamp, outdoortemperature, windchill, dewpoint, outdoorheatindex FROM data where tstamp >= '$start' and tstamp <= '$stop' ORDER BY 1";
$query=mysql_query($sql);
$i=0; while ($list = mysql_fetch_assoc($query)) {
if (date("I",time())==0) {
$time[$i]=($list['tstamp']+3600)*1000;
}
else {
$time[$i]=($list['tstamp']+7200)*1000;
}$outdoortemperature[$i]=$list['outdoortemperature']*1;
$windchill[$i]=$list['windchill']*1;
$dewpoint[$i]=$list['dewpoint']*1;
$outdoorheatindex[$i]=$list['outdoorheatindex']*1;
$i++;
}
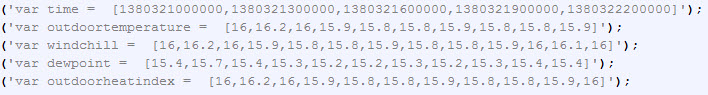
?>Before attacking the Highcharts hand, we still put the data in JSON format.
eval(<?php echo "'var time = ".json_encode($time)."'" ?>);
eval(<?php echo "'var outdoortemperature = ".json_encode($outdoortemperature)."'" ?>);
eval(<?php echo "'var windchill = ".json_encode($windchill)."'" ?>);
eval(<?php echo "'var dewpoint = ".json_encode($dewpoint)."'" ?>);
eval(<?php echo "'var outdoorheatindex = ".json_encode($outdoorheatindex)."'" ?>);
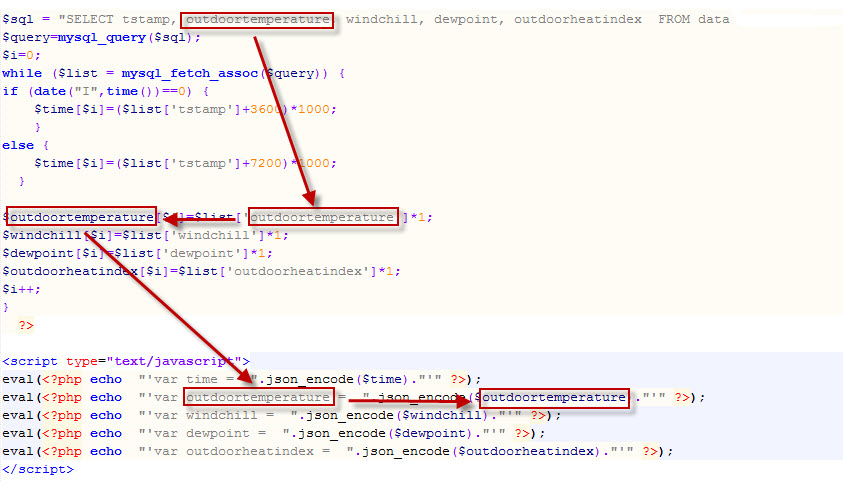
</script>What you give us a table type: we must understand the process sexplicado above: get a field of the database here "outdoortemperature" made ??a list with these values ??and ultimately transform them into Json.
Of course, if you want to draw another field in the database, such as wind speed, the field is replaced
"outdoortemperature" by the "WinSpeed ????" field.Within selecting "SELECT" keep only the values you want to call, you can put the number you want, no
limit. Of course, if you want to draw five values, you must also add the "WHILE" and below in the json_encode..


|
|
||||||||

|
Station
Davis Vantage Pro 2 + station agricole - Weatherlink
6.0.0 - GraphWeather
3.0.15
© 2010-2013, Météo Villarzel - Webmaster Aubert Pierre-André Attention, les données météo publiées sur ce site sont issues d'une station météo personnelle et ne sont données qu'à titre indicatif, elles ne peuvent en aucun cas être utilisées pour garantir la protection des personnes ou de biens quelconques. |
|||||
|
Stations amies
|
|||||
|
|
|
|
|
|
|