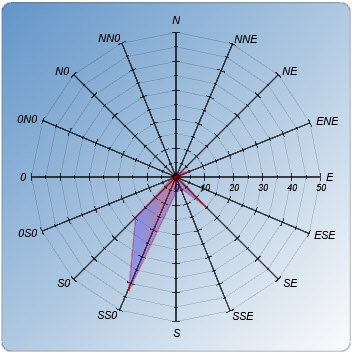
Une rose des vent avec la balise "radarplot"
|
|
Nous allons créer une feuille de style pour avoir ce résultat.
|
|
|
|
|
Comme pour nos premiers graphiques, on commence par créer
une image et un cadre "frame"
avec un fond en dégradé.
|
|
 <?xml version="1.0" encoding="iso-8859-1" ?>
<stylesheet>
	<image width="350" height="350" />
	<frame width="350" height="350" position-x="0" position-y="0" shadow="0">
	<background color1="FF6699CC" color2="FFFFFFFF" gradient="1" gradient-direction="135" />
    <border cornerradius="0" color="55555555" thick="1" />
	</frame>
</stylesheet>
|
 |
On rajoute la balise "radarplot"
avec ses dimensions, positions et marges
|
|
<radarplot width="350" height="350" shadow="0" position-x="0" position-y="0" margin-top="30" margin-right="30" margin-bottom="30" margin-left="30">
|
|
On rajoute l'axe X "axis"
le titre "titles" et le label
"labels"
|
|
<axis color="FF000000" grid="1" autoscale="1" min="0" max="0">
      <titles text="E;ENE;NE;NNE;N;NN0;N0;0N0;0;0S0;S0;SS0;S;SSE;SE;ESE">
          <font color="FF000000" facename="Arial" size="14" weight="400" italic="1" />
      </titles>
      <labels labelinterval="1" angle="0" format=".0" side="left" hide="0">
          <font color="FF000000" facename="Arial" size="12" weight="400" italic="1" />
      </labels>
  </axis>
|
|
Pour que le graphique soit visible, il faut rajouter les données
"data" avec
la sonde de la direction du vent "wind_direction"
comme précédemment avec l'humidité
on place deux fois la sonde pour mettre un dégradé
de couleur (2 ème ligne). On cache les légendes
avec la balise "hidelegend"
|
|
<data>
        <wind_direction legend="" color1="60FF0000" color2="400000FF" antialiasing="1" filled="1" hidelegend="1"/>
        <wind_direction legend="" color1="60FF0000" antialiasing="1" hidelegend="1" thick="1.2" />
 </data>
|
|
Vous pouvez améliorer la présentation en rajoutant
par exemple une image de fond avec la carte de votre région.
|
|
<background texture="carte1.png" stretch="1" />
|
|
Le code complet.
|
|
 <?xml version="1.0" encoding="iso-8859-1" ?>
<stylesheet>
  <image width="350" height="350" />
  <frame width="350" height="350" >
    <background color1="FF6699CC" color2="FFFFFFFF" gradient="1" gradient-direction="135" />
    <border cornerradius="10" color="55555555" thick="2" />
  </frame>
  <!-- ================= Radarplot ================= -->
    <radarplot width="350" height="350" shadow="0" position-x="0" position-y="0" margin-top="30" margin-right="30" margin-bottom="30" margin-left="30">
      <axis color="FF000000" grid="1" autoscale="1" min="0" max="0">
        <titles text="E;ENE;NE;NNE;N;NN0;N0;0N0;0;0S0;S0;SS0;S;SSE;SE;ESE">
          <font color="FF000000" facename="Arial" size="14" weight="400" italic="1" />
        </titles>
        <labels labelinterval="1" angle="0" format=".0" side="left" hide="0">
          <font color="FF000000" facename="Arial" size="12" weight="400" italic="1" />
        </labels>
      </axis>
      <data>
        <wind_direction legend="" color1="60FF0000" color2="400000FF" antialiasing="1" filled="1" hidelegend="1"/>
        <wind_direction legend="" color1="60FF0000" antialiasing="1" hidelegend="1" thick="1.2" />
      </data>
     <background texture="carte1.png" stretch="1" />
    </radarplot>
  </stylesheet>
|
|
Pour aller plus loin, on peut aussi combiner plusieurs graphiques
sur la même page, sur notre graphique nous allons rajouter
une "ciculargauge" pour
indiquer la direction actuelle du vent.
On reprend notre graphique ci-dessus et il faut enregistrer cette
image dans le même dossier

Puis on rajoute le code de la circulargauge. je l'ai mise en rouge
pour bien voir la différence.
|
|
	<circulargauge width="340" height="340" position-x="5" position-y="5" margin-top="5" margin-right="5" margin-bottom="5" margin-left="5" >
		<axis color="FFFF0000" min="0" max="360" titlemargin="0" titleside="bottom" fromangle="90" toangle="450">
			<labels hide="1">
			</labels>
			<ticks majorticks="9" minorticks="3" side="bottom" hidefirst="0" hidelast="0" hideminorticks="0" hide="0" minorticksize="5" majorticksize="9"/>
		</axis>
		<index>
			<current_wind_direction texture="indic_vent.png" filled="0" side="100" thick="29" axisdelta="10" />
		</index>
	</circulargauge>
|
|
| |
|
| |
|
| |
|
Une autre petite pose  et on passe à la page suivante
 |
|
 |
Untitled Document
|
|
|
Vous avez aimé ce tutoriel, il vous a rendu service,
alors dites-le-moi.
|
|
|
|
Ou aidez-moi à maintenir ce site en fonction.
|
|
|
|
|
| |
|
|
|