Erreur 15

Un problème, une question sur la partie PHP des graphiques

Modérateurs : jturlier, Météo Villarzel

JP54
Messages : 331
Enregistré le : 15 févr. 2014, 06:44
Localisation : JARNY Meurthe-et-Moselle (54) Région Lorraine
Contact :

Erreur 15

Message par JP54 » 09 mars 2023, 18:29

Bonjour,
J'ai créé un graphique qui compare les températures moyennes quotidiennes aux températures moyennes normales quotidiennes.
Les températures quotidiennes proviennent de la table NOAA_jour et les températures moyennes normales quotidiennes proviennent d'une table de j'ai créé avec mes propres données.
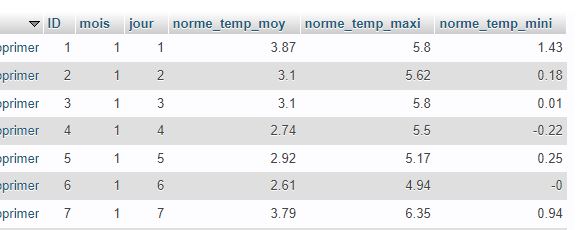
Lien vers la structure de ma table pour les normales quotidiennes.
https://www.meteo-jarny.com/Images/Foru ... /table.JPG
Voilà ce que donne le graphique pour une année complète, ici l'année 2022
https://www.meteo-jarny.com/test/graph-test9.php

Maintenant j'ai un problème pour l'année en cours, j'ai une erreur 15 qui dit:
Highcharts s'attend à ce que les données soient triées.
Cela se produit lors de la création d'une série de lignes ou d'un stock où les données ne sont pas triées par ordre X croissant.
Pour des raisons de performances, Highcharts ne trie pas les données, mais nécessite que l'implémenteur pré-trie les données.

https://www.meteo-jarny.com/test/graph-test10.php

J'ai pas mal chercher sur différents forums, mais je n'arrive pas à trouver une solution.
Je pense que le problème vient de mes normales qui sont sur l'année complète et que mes données ne le sont pas. Le mieux serait peut-être d'appeler les normales en fonctions des jours sur le graphique. En faite je ne sais pas trop.
Je mets le code complet de mon graphique si quelqu'un à une idée.

Code : Tout sélectionner

<?php
        require("...");                     
        $sql="select max(tstamp) from noaa_jour";
        $query=mysqli_query($conn,$sql);                  
        $list=mysqli_fetch_array($query);
		
        $year= '2023';
        $start = mktime(0,0,0,1,1,$year);
        $stop = mktime(23,59,59,12,31,$year);					  
       
		
        if($year == 2004 OR $year == 2008 OR $year == 2012 OR $year == 2016 OR $year == 2020 OR $year == 2024){
        $sql = "SELECT jour, mois, norme_temp_moy  FROM normale_journaliere ";  
        }else{
        $sql = "SELECT jour, mois, norme_temp_moy  FROM normale_journaliere_365 ";  
        }	
        $query = mysqli_query($conn,$sql);                   
        $i=0;
        while ($list = mysqli_fetch_assoc($query)) {
        $dnorme[$i]=round($list['norme_temp_moy']*1,1);   
	    $i++;
        } 
			
        $sql = "SELECT tstamp, Moy_T  FROM noaa_jour WHERE ((tstamp) between '$start' AND '$stop') ";  
        $query=mysqli_query($conn,$sql);                   
        $i=0;
        while ($list = mysqli_fetch_assoc($query)) { 
        $dtime[$i] = $list['tstamp']*1000;   
        $dmean[$i]=$list['Moy_T']*1;	
        $ecart[$i] = $dmean[$i] - $dnorme[$i];							
        $i++;
        }
				
mysqli_close($conn);
	   	
?>
  
<script language="JavaScript" type="text/javascript">
eval(<?php echo  "'var dTime =  ".json_encode($dtime)."'" ?>);
eval(<?php echo  "'var dmean =  ".json_encode($dmean)."'" ?>);
eval(<?php echo  "'var dnorme =  ".json_encode($dnorme)."'" ?>);
eval(<?php echo  "'var ecart =  ".json_encode($ecart)."'" ?>);


</script>

    <!-- fichier JS et librairie Highcharts pour graphique -->
	<script src="https://code.jquery.com/jquery-3.1.1.min.js"></script>
    <script type="text/javascript" src="../Librairie-highcharts/highstock/code/highstock.js"></script>
    <script type="text/javascript" src="../Librairie-highcharts/highstock/code/highcharts-more.js"></script>
    <script type="text/javascript" src="../Librairie-highcharts/highstock/code/modules/exporting.js"></script>
    <script type="text/javascript" src="../Librairie-highcharts/highstock/code/modules/debugger.js"></script>
    <script type="text/javascript" src="../Librairie-highcharts/highstock/code/modules/boost.js"></script>
    <script type="text/javascript" src="../Librairie-highcharts/highstock/code/themes/gray.js"></script>
    <script type="text/javascript" src="../Librairie-highcharts/jquery/overlib.js"></script>
    <script type="text/javascript" src="../Librairie-highcharts/jquery/overlib_fade.js"></script> 				
    <script type="text/javascript" src="../Librairie-highcharts/jquery/formatNombre.js"></script>		
    <script type="text/javascript" src="../Librairie-highcharts/jquery/moment.js"></script>		
    <script type="text/javascript" src="../Librairie-highcharts/jquery/moment-with-locales.js"></script>		
    <script type="text/javascript" src="../Librairie-highcharts/jquery/jquery-ui/jquery.ui.datepicker-fr.js"></script>
    <script type="text/javascript" src="../Librairie-highcharts/jquery/jquery-ui/jquery-ui.js"></script>
    <script type="text/javascript" src="../Librairie-highcharts/jquery/jquery-ui/jquery-ui.min.js"></script>
	
<script type="text/javascript">	
//<![CDATA[
		
    let income = dmean
    let outcome = dnorme
    let date = dTime

    //créer une fonction pour trouver où les lignes se croisent, pour les colorer correctement
    function intersect(x1, x2, y1, y2, y3, y4) {
        return ((x2 * y1 - x1 * y2) - (x2 * y3 - x1 * y4)) / ((y4 - y3) - (y2 - y1));
    }

    var ranges = []; //stocke toutes les données du graphique comme ceci [x, y1, y2]
    var incomeZones = []; //stocke les différentes zones en fonction de l'intersection des lignes
    var incomeBiggerBool = true; //utilisé pour garder une trace de la couleur actuelle

    const redGradient = {
        linearGradient: [0, 0, 0, 200],
        stops: [
           [0, 'rgba(255, 0, 0, .8)'],
           [1, 'rgba(255, 255, 255, .8)']
        ]
    },
     blueGradient = {
        linearGradient: [0, 0, 0, 200],
        stops: [
           [0, 'rgba(255, 255, 255, .8)'],
           [1, 'rgba(0, 19, 255, .8)']
        ]
     };

    //parcourir toutes les valeurs du tableau des revenus et des résultats (en supposant qu'elles sont de même longueur). Remplissez le tableau des plages et créez des zones de couleur.
    //Les zones se colorent jusqu'à un point donné, il faut donc pousser une couleur à la fin, avant qu'elle ne se croise
    for (i = 0; i < income.length; i++) {
        ranges.push([date[i], income[i], outcome[i]]); //push to range array
        if (income[i] < outcome[i] && incomeBiggerBool) {
            incomeZones.push({
              value: intersect(date[i - 1], date[i], income[i - 1], income[i], outcome[i - 1], outcome[i]),
              color: redGradient
            }); //push to zone array 
            incomeBiggerBool = false;
        } else if (income[i] > outcome[i] && !incomeBiggerBool) {
            incomeZones.push({
              value: intersect(date[i - 1], date[i], income[i - 1], income[i], outcome[i - 1], outcome[i]),
              color: blueGradient
            }); //push to zone array 
            incomeBiggerBool = true;
        }
    }
    //les zones colorent jusqu'à un point donné, il faut donc pousser une couleur à la fin également :
    if (incomeBiggerBool) {
        incomeZones.push({
            value: Infinity,
            fillColor: redGradient,
        })
    } else {
        incomeZones.push({
            value: Infinity,
            fillColor: blueGradient,
        })
    }
    

    function comArr(unitsArray) {
       var outarr = [];
       for (var i = 0; i < dTime.length; i++) {
           outarr[i] = [dTime[i], unitsArray[i]];
       }
        return outarr;
    }
	
        $(function() {
            Highcharts.setOptions({
				global : {
                   useUTC : false
                },
                lang: {
                    months: ['Janvier', 'Février', 'Mars', 'Avril', 'Mai', 'Juin', 'Juillet', 'Août', 'Septembre', 'Octobre', 'Novembre', 'Décembre'],
                    weekdays: ['Dimanche', 'Lundi', 'Mardi', 'Mercredi', 'Jeudi', 'Vendredi', 'Samedi'],
                    shortMonths: ['Jan', 'Fev', 'Mar', 'Avr', 'Mai', 'Juin', 'Juil', 'Août', 'Sept', 'Oct', 'Nov', 'Déc'],
                    decimalPoint: ',',
                    resetZoom: 'Reset zoom',
                    resetZoomTitle: 'Reset zoom  1:1',
                    contextButtonTitle: 'Menu contextuel du graphique',
                    viewFullscreen: 'Voir le graphique en plein écran',
                    downloadPNG: "Télécharger au format PNG image",
                    downloadJPEG: "Télécharger au format JPEG image",
                    downloadPDF: "Télécharger au format PDF document",
                    downloadSVG: "Télécharger au format SVG vector image",
                    printChart: "Imprimer le graphique",
                    loading: "Chargement en cours...",
                    rangeSelectorFrom: "Du",
                    rangeSelectorTo: "Au"
                }
            });

            var chart = Highcharts.stockChart('container', {

            chart: {
                type: 'arearange',
                zoomType: 'x',//A supprimer
                alignTicks: true,
                plotBorderColor: '#346691',
                plotBorderWidth: 1,
                marginBottom: 60,
            },
			
	        title: {
                text: 'Températures moyennes quotidiennes <?php  echo $year ; ?>'
            },

			subtitle: {
                text: 'Source: Météo Jarny',
                x: 0,
				y: 33
            },

			credits: {
                text: '© Météo Jarny',
                href: ''
			},
			
		    legend: {
	    	    enabled: true,
	    	    align: 'top',
	    	    layout: 'horizontal',
	    	    align: 'center',
	    	    shadow: true
	        },
			
            exporting: {
                enabled: true
            },
			
            rangeSelector: {
                buttonTheme: {
                    width: 65
                },
                buttons: [{
                type: 'month',
                count: 3,
                text: '3 mois'
                },{
                type: 'month',
                count: 6,
                text: '6 mois'
                },{
                type: 'all',
                count: 1,
                text: '1 an'
               }],
               inputEnabled: false,
                selected: 3,
            },
			
            scrollbar: {
                enabled: true
            },
			
            navigator: {
                enabled: false
            },
			
            yAxis: [{
                tickInterval: 10,
                opposite: false,
                showFirstLabel: true,
                showLastLabel: true,
                labels: {
                    formatter: function() {
                        return this.value + ' °C';
                    },
                    align: 'right',
                    x: -10,
                    y: 3,
                },
                title: {
                    text: 'Température (°C)',
                },
            }],

            time: {    
                getTimezoneOffset: function(timestamp) {
                    var zone = 'Europe/Paris',
                    timezoneOffset = -moment.tz(timestamp, zone).utcOffset();
                    return timezoneOffset;
                },
                timezone: 'Europe/Paris',
                //timezoneOffset:0
                useUTC: false,
            },

            xAxis: {
                type: 'datetime',
				    labels: {
                        format: '{value: %b %Y}',
                        align: 'center',			
                    },
                gridLineColor: '#BDBDBD',
                gridLineWidth: 0.5,
                startOnTick: false,
                dateTimeLabelFormats: {
                    day: '%e %b',
                    hour: '%Hh%M',
                    millisecond: '%H:%M:%S.%L',
                    minute: '%Hh%M',
                    month: '%b %y',
                    second: '%H:%M:%S',
                    week: '%e %b',
                    year: '%Y',
                },
                units: [
                    ['millisecond', [1, 2, 5, 10, 20, 25, 50, 100, 200, 500]],
                    ['second', [1, 2, 5, 10, 15, 30]],
                    ['minute', [1, 2, 5, 10, 15, 30]],
                    ['hour', [1, 2, 3, 4, 6, 8, 12]],
                    ['day', [1, 2, 5]],
                    ['week', [1, 2, 4]],
                    ['month', [1, 3, 6]],
                    ['year', null]
                ],
            },
			
            plotOptions: {},
			
            tooltip: {
                split: false,
			    shared: true,
                valueDecimals: 1,
                borderColor: 'royalblue',
                borderWidth: 1,
                backgroundColor: '#2E2E2E',
                dateTimeLabelFormats: {
                    day: "%A %e %B %Y",
                    hour: "%A %e %B %Y à %Hh %Mmn",
                    millisecond: "%A %e %B %Y à %H:%M:%S.%L",
                    minute: "%a %e %B %Y à %Hh %Mmn",
                    month: "%B %Y",
                    second: "%A %e %B %Y à %Hh %Mmn %Ss",
                    week: "Semaine depuis %A %e %b %Y",
                    year: "%Y",
                },
                headerFormat: '<table cellspacing="2" cellpadding="0" style="font-size:12px"><tr><td colspan="4" >{point.x:%A %e %B %Y}</td></tr>',
                xDateFormat: "%A %e %B à %Hh %Mmn",
			    formatter: function() {
				    const point = this.points[0].point,
						maxi = point.high,
						mini = point.low,
						diff = mini - maxi;
						    if(diff < 0){
								var prefix = "inférieure";
								var sign="";
							} else if (diff > 0){
								var prefix = "supérieure";
								var sign="+";
							} else{
								var prefix = "égale";
								var sign="";
							}							
							
				    let res = '';

				    res += '<span style="font-size: 10px">' + Highcharts.dateFormat('%A %e %B %Y', this.x) + '</span><br/>';
 				    res += '<tr>' +
					    '<td align="left"><span style="color:#FFFFFF">\u25CF </span><span style="color:#FFFFFF">Température moyenne</span></td>' +
					    '<td align="center">: </td>' +
					    '<td align="right"><b><span style="color:#FFFFFF">'+Highcharts.numberFormat(mini, 1, ",", " ") + '</span></b></td>' +
					    '<td align="left"><span style="color:#FFFFFF"> °C</span></td>' +
					    '</tr>' +
					    '<br />' +
					    '<tr>' +
					    '<td align="left"><span style="color:#000000">\u25CF </span><span style="color:#FFFFFF">Température moyenne normale</span></td>' +
					    '<td align="center">: </td>' +
					    '<td align="right"><b><span style="color:#FFFFFF">'+Highcharts.numberFormat(maxi, 1, ",", " ") + '</span></b></td>' +
					    '<td align="left"><span style="color:#FFFFFF"> °C</span></td>' +				
					    '</tr>' +
					    '<br />' +
					    '<tr>' +
					    '<td align="left"><span style="color:#2E2E2E">\u25CF </span><span style="color:#FFFFFF">Différence</span></td>' +
					    '<td align="center">: </td>' +
					    '<td align="right"><b><span style="color:#FFFFFF">'+sign+Highcharts.numberFormat(diff, 1, ",", " ") + '</span></b></td>' +
					    '<td align="left"><span style="color:#FFFFFF"> °C</span></td>' +
					    '</tr>';
				    return res;
			    }
            },

            series: [{
                name: 'Différence',
			    id: 'main',
                data: ranges,
                zoneAxis: 'x',
                zones: incomeZones,
                color: {
                    linearGradient: {
                        x1: 0,
                        x2: 0,
                        y1: 0,
                       y2: 1
                    },
                    stops: [
                        [0, '#F78181'],
                        [1, '#2E64FE']
                    ]
                }
            }, {
				name: 'Température moyenne',
			    type: 'spline',
				lineWidth: 1,
			    color: '#FFFFFF',
			    data: income.map((o, i) => [date[i], o]),
		    }, {
				name: 'Température moyenne normale',
			    type: 'spline',
				lineWidth: 1,
			    color: '#000000',
			    data: outcome.map((o, i) => [date[i], o])
		    }]  
			
		}, function(chart) {
                chart.renderer.image('../Images/logo-graphique/logo-jarny.gif', 8, 8, 102, 50)		
                .add();            
            });
        });
//]]>
</script>
    <div id="container" style="width: 790px; height: 400px; margin: 0 auto"></div>
	
</body>
</html>

Station VP2 Weatherlink 5.8.1 VP2SQL 3.0.0.17 NOAAtable 1.0.0.30 Windows 7 Pro
http://www.meteo-jarny.com/

Avatar du membre
PascalWMR
Messages : 323
Enregistré le : 16 févr. 2014, 09:28
Localisation : CONFLANS EN JARNISY (F54800)
Contact :

Re: Erreur 15

Message par PascalWMR » 12 mars 2023, 09:50

Salut Pascal

Il faut pré trier les données sur l'axe de X puisque tes différentes séries utilisent un axe commun X
Highcharts te demande ça car tu utilise des fonction qui re trie tes données (push)

Il faut activer dataSorting et spécifier l'axe sur lequel le tri doit être fait.

le pré tri se fait soit série par série ou globalement dans plotOptions.

Explication en glaouche ici
https://api.highcharts.com/highcharts/s ... ataSorting

Globalement ça donne ça

Code : Tout sélectionner

    plotOptions: {
        series: {
            dataSorting: {
                enabled: true,
                sortKey: 'x'
            }
        }
    },
C'est une nouvelle (enfin presque, parce-que c'est sorti depuis plus de 2 ans je crois) fonctions de Highcharts

A+
Pascal
Station VP2Plus, Windows 10 64 bits,WeatherLink 6.0.5, VP2SQL, Graphiques Dynamiques à partir d'une BDD MySQL
Météo Conflans-en-Jarnisy
Image

JP54
Messages : 331
Enregistré le : 15 févr. 2014, 06:44
Localisation : JARNY Meurthe-et-Moselle (54) Région Lorraine
Contact :

Re: Erreur 15

Message par JP54 » 12 mars 2023, 10:39

Bonjour Pascal,
Ca ne fonctionne pas avec dataSorting, j'avais déjà essayer.
https://www.meteo-jarny.com/test/graph-test11.php
J'ai mis dataSorting dans plotOptions
Il y quand même du mieux, je n'ai plus l'erreur 15. Mais le zoom ne fonctionne plus, la date dans le tooltip n'est pas bonne et je n'ai plus la couleur bleu pour les différences négatives. J'ai également essayé série par série, ce n'est pas bon non plus.
Il n'y pas moyen de rendre invisible les valeurs températures moyennes normales après la date du jour en cours, ça règlerais peut-être le problème. C'est une idée. Je m'arrache les cheveux depuis un bon moment sur ce graphique sans trouver une solution.
Station VP2 Weatherlink 5.8.1 VP2SQL 3.0.0.17 NOAAtable 1.0.0.30 Windows 7 Pro
http://www.meteo-jarny.com/

Avatar du membre
PascalWMR
Messages : 323
Enregistré le : 16 févr. 2014, 09:28
Localisation : CONFLANS EN JARNISY (F54800)
Contact :

Re: Erreur 15

Message par PascalWMR » 12 mars 2023, 11:00

Re Pascal

Pourquoi tu te complique la vie avec tes fonctions pour colorer tes graph.

Il existe des fonctions Highcharts toutes faites avec color en negativeColor.

Pascal
Station VP2Plus, Windows 10 64 bits,WeatherLink 6.0.5, VP2SQL, Graphiques Dynamiques à partir d'une BDD MySQL
Météo Conflans-en-Jarnisy
Image

JP54
Messages : 331
Enregistré le : 15 févr. 2014, 06:44
Localisation : JARNY Meurthe-et-Moselle (54) Région Lorraine
Contact :

Re: Erreur 15

Message par JP54 » 12 mars 2023, 11:09

Tout simplement parce que je n'y suis pas arrivé. j'arrive à ce résultat avec negativColor.
https://www.meteo-jarny.com/test/graph-test.php
Et comme tu le vois, la courbe écart et sur la ligne 0 et ce n'est pas ce que je veux. Dans cet exemple il y a dataGrouping dans les séries

Code : Tout sélectionner

    function comArr(unitsArray) { 
        var outarr = [];
        for (var i = 0; i < dTime.length; i++) {
         outarr[i] = [dTime[i], unitsArray[i]];
        }
      return outarr;
    }		
$(function () {
    Highcharts.setOptions({
	        lang: {
		        months: ['Janvier', 'Février', 'Mars', 'Avril', 'Mai', 'Juin', 'Juillet', 'Août', 'Septembre', 'Octobre', 'Novembre', 'Décembre'],
		        weekdays: ['Dimanche', 'Lundi', 'Mardi', 'Mercredi', 'Jeudi', 'Vendredi', 'Samedi'],
		        shortMonths: ['Jan', 'Fev', 'Mar', 'Avr', 'Mai', 'Juin', 'Juil','Août', 'Sept', 'Oct', 'Nov', 'Déc'],
		        decimalPoint: ',',
		        resetZoom: 'Reset zoom',
                resetZoomTitle: 'Reset zoom  1:1',
			    contextButtonTitle: 'Menu contextuel du graphique',
			    viewFullscreen: 'Voir le graphique en plein écran',
                downloadPNG: "Télécharger au format PNG image",
                downloadJPEG: "Télécharger au format JPEG image",
                downloadPDF: "Télécharger au format PDF document",
                downloadSVG: "Télécharger au format SVG vector image",
			    printChart: "Imprimer le graphique",
                loading: "Chargement en cours...",
			    rangeSelectorFrom: "Du",
                rangeSelectorTo: "Au"		

	        }
    });
   
    	window.chart = new Highcharts.StockChart({  	
		    chart: {
		        renderTo: 'container',
				zoomType: 'x',
				alignTicks: true,
                plotBorderColor: '#346691',
				plotBorderWidth: 1,
				marginBottom: 30,
		    },

            navigator: {
                enabled: false
            },	
					    
		    rangeSelector : {
			    buttonTheme: {
                    width:65
                },
				buttons: [{
					type: 'month',
					count: 3,
					text: '3 mois'
				}, {
					type: 'month',
					count: 6,
					text: '6 mois'
				},{
					type: 'month',
					count: 12,
					text: '1 an'
				}],
				inputEnabled: false, 
				selected : 3,								
			},
			
			subtitle: {
                text: 'Températures moyennes quotidiennes. Source: Météo Jarny',
                x: 0,
				y: 33
            },
			
			credits: {
                text: '© Météo Jarny',
                href: ''
			},
			
		    legend: {
	    	    enabled: false,
	    	    align: 'top',
	    	    layout: 'horizontal',
	    	    align: 'center',
	    	    shadow: true
	        },
			
		    title: {
		        text: 'Evolution de la température',
		    },
			
		    yAxis: [{ 
			 tickInterval: 10,
		        opposite:false,
                showFirstLabel: true,
                showLastLabel: true,
		        labels: {
                    formatter: function() {
                        return this.value +' °C';
                    },
			    align : 'right',
                x : -10,
                y : 3,
                },	
				title: {
                    text: 'Température (°C)',
                },
				plotLines: [{
                    value: 0,
	    		    width: 1,
	    		    color: '#FFFF00',
                }]
            }],

			time:{
			    //Date:undefined
		        getTimezoneOffset: function (timestamp) {
				var zone = 'Europe/Paris',
			    timezoneOffset = -moment.tz(timestamp, zone).utcOffset();
				return timezoneOffset;
		    	},
			    timezone:'Europe/Paris',
			    //timezoneOffset:0
			    useUTC: false,
		    },

			xAxis: {
                type: 'datetime',
				alternateGridColor:'', 
				gridLineColor:'#BDBDBD',
				gridLineWidth: 0.5,         
				startOnTick: false,
				dateTimeLabelFormats:{
				day:'%e %b',
				hour:'%Hh%M',
				millisecond:'%H:%M:%S.%L',
				minute:'%Hh%M',
				month:'%b %y',
				second:'%H:%M:%S',
				week:'%e %b',
				year:'%Y',
			},
			units:[
				['millisecond',[1, 2, 5, 10, 20, 25, 50, 100, 200, 500]],
				['second',[1, 2, 5, 10, 15, 30]],
				['minute',[1, 2, 5, 10, 15, 30]],
				['hour',[1, 2, 3, 4, 6, 8, 12]],
				['day',[1,2,5]],
				['week',[1,2,4]],
				['month',[1, 3, 6]],
				['year',null]
			],
            },
			
		    tooltip: {
			    animation:true,
			    shared: true,
                crosshairs: true,
				enabled:true,
				followPointer:true,
				split:false,
				valueDecimals : 1,
				borderColor: 'royalblue',
	    	    borderWidth: 1,
				backgroundColor: '#2E2E2E',
				dateTimeLabelFormats:{
				    day:"%A %e %B %Y",
				    hour:"%A %e %B %Y à %Hh %Mmn",
				    millisecond:"%A %e %B %Y à %H:%M:%S.%L",
				    minute:"%a %e %B %Y à %Hh %Mmn",
				    month:"%B %Y",
				    second:"%A %e %B %Y à %Hh %Mmn %Ss",
				    week:"Semaine depuis %A %e %b %Y",
				    year:"%Y",
			    },
				headerFormat:'<table cellspacing="2" cellpadding="0" style="font-size:12px"><tr><td colspan="4" class="TD_Header_Tooltip">{point.x:%A %e %B %Y}</td></tr>',
				xDateFormat:"%A %e %B à %Hh %Mmn",
			},
			
			
		    series: [{
		        name: 'Température moyenne',
				type: 'line',
				color: '#FFFFFF',
				lineWidth: 1.3,
		        data: comArr(dmean),
								tooltip:{
					pointFormatter:function(){
						var s= '<tr><td align="left"><br /><span style="color:'+[this.color]+'">\u25CF </span>'+[this.series.name]+'</td>'
						s = s +'<td align="center">: </td>'
						s = s +'<td align="right"><b>'+Highcharts.numberFormat(this.y,1,","," ")+'</b></td>'
						s = s +'<td align="left"> °C</td></tr>';
						return s;
					},
				},				
				dataGrouping: {
					units: [[
						'day', // unit name
						[1] // allowed multiples
					], [
						'day',
						[1]
					]]
		        },
		    },{
		        name: 'Température moyenne Normale',
				dashStyle : 'shortdash',
				color: '#FFFF00',
				lineWidth: 1.3,				
		        data: comArr(dnorme),
								tooltip:{
					pointFormatter:function(){
						var s= '<tr><td align="left"><br /><span style="color:'+[this.color]+'">\u25CF </span>'+[this.series.name]+'</td>'
						s = s +'<td align="center">: </td>'
						s = s +'<td align="right"><b>'+Highcharts.numberFormat(this.y,1,","," ")+'</b></td>'
						s = s +'<td align="left"> °C</td></tr>';
						return s;
					},
				},				
				dataGrouping: {
					units: [[
						'day', // unit name
						[1] // allowed multiples
					], [
						'day',
						[1]
					]]
		        },
		    },{
		        name: 'ecart',
				type: 'area',
					color: {
                        linearGradient: { x1: 0, x2: 0, y1: 1, y1: 1.5 },
                            stops: [
			                    [0, 'rgba(255, 255, 255, .8)'],
                                [1, 'rgba(255, 0, 0, .8)']                
                            ]
                    },
			        negativeColor: {
					    linearGradient: { x1: 0, x2: 0, y1: 1, y1: 1.5 },
					        stops: [
					            [0, 'rgba(0, 19, 255, .8)'] ,
						        [1, 'rgba(255, 255, 255, .8)']						
					        ]
				    },

				lineWidth: 1.3,				
		        data: comArr(ecart),
								tooltip:{
					pointFormatter:function(){
						var s= '<tr><td align="left"><br /><span style="color:'+[this.color]+'">\u25CF </span>'+[this.series.name]+'</td>'
						s = s +'<td align="center">: </td>'
						s = s +'<td align="right"><b>'+Highcharts.numberFormat(this.y,1,","," ")+'</b></td>'
						s = s +'<td align="left"> °C</td></tr>';
						return s;
					},
				},				
				dataGrouping: {
					units: [[
						'day', // unit name
						[1] // allowed multiples
					], [
						'day',
						[1]
					]]
		        },
		    },
			
			]
		
		}, function(chart) {
        chart.renderer.image('../Images/logo-graphique/logo-jarny.gif', 8, 8, 102, 50)		
        .add();  
            // apply the date pickers
            setTimeout(function() {
                $('input.highcharts-range-selector', $('#' + chart.options.chart.renderTo)).datepicker({minDate:-400,maxDate:0,})
            },0)
        });
});

Station VP2 Weatherlink 5.8.1 VP2SQL 3.0.0.17 NOAAtable 1.0.0.30 Windows 7 Pro
http://www.meteo-jarny.com/

JP54
Messages : 331
Enregistré le : 15 févr. 2014, 06:44
Localisation : JARNY Meurthe-et-Moselle (54) Région Lorraine
Contact :

Re: Erreur 15

Message par JP54 » 12 mars 2023, 11:18

je me suis tromper de graphique, c'est celui-là.
https://www.meteo-jarny.com/test/graph-test13.php
Station VP2 Weatherlink 5.8.1 VP2SQL 3.0.0.17 NOAAtable 1.0.0.30 Windows 7 Pro
http://www.meteo-jarny.com/

Avatar du membre
PascalWMR
Messages : 323
Enregistré le : 16 févr. 2014, 09:28
Localisation : CONFLANS EN JARNISY (F54800)
Contact :

Re: Erreur 15

Message par PascalWMR » 12 mars 2023, 13:07

Re

J'ai pas testé mais il y a peut être une piste

Essaie
series.
onPoint
position
offsetY ou Y

https://api.highcharts.com/highcharts/s ... on.offsetX
Station VP2Plus, Windows 10 64 bits,WeatherLink 6.0.5, VP2SQL, Graphiques Dynamiques à partir d'une BDD MySQL
Météo Conflans-en-Jarnisy
Image

JP54
Messages : 331
Enregistré le : 15 févr. 2014, 06:44
Localisation : JARNY Meurthe-et-Moselle (54) Région Lorraine
Contact :

Re: Erreur 15

Message par JP54 » 12 mars 2023, 15:17

J'ai essayé, mais sans succès, page blanche.

Code : Tout sélectionner

onPoint{
    position{
        Y: 20,
    }
},
J'ai également essayé offsetY
Station VP2 Weatherlink 5.8.1 VP2SQL 3.0.0.17 NOAAtable 1.0.0.30 Windows 7 Pro
http://www.meteo-jarny.com/

Avatar du membre
PascalWMR
Messages : 323
Enregistré le : 16 févr. 2014, 09:28
Localisation : CONFLANS EN JARNISY (F54800)
Contact :

Re: Erreur 15

Message par PascalWMR » 12 mars 2023, 19:15

Non il ne faut pas donner une position y fixe mais pour chaque point de la série ecart il faut donner à offsetY la valeur de la série normale.

Si j'ai bien compris la fonction, cela devrait aligner la serie ecart sur la serie normale et non pas sur la valeur 0
Station VP2Plus, Windows 10 64 bits,WeatherLink 6.0.5, VP2SQL, Graphiques Dynamiques à partir d'une BDD MySQL
Météo Conflans-en-Jarnisy
Image

JP54
Messages : 331
Enregistré le : 15 févr. 2014, 06:44
Localisation : JARNY Meurthe-et-Moselle (54) Région Lorraine
Contact :

Re: Erreur 15

Message par JP54 » 12 mars 2023, 19:43

Ok Pascal, je testerais demain
Station VP2 Weatherlink 5.8.1 VP2SQL 3.0.0.17 NOAAtable 1.0.0.30 Windows 7 Pro
http://www.meteo-jarny.com/

Répondre